What is Technical Analysis? Mastering Its Role in Investing

While fundamental analysis provides a foundational perspective on financial evaluations, the integration of technical analysis offers an additional dimension to the assessment. This guide elaborates on the role of technical analysis in investment, highlighting its primary indicators, principles, and visual depictions.
Technical analysis has evolved as a significant tool within the financial sector, facilitating stakeholders in making informed financial decisions.
Since its origin, technical analysis has been acknowledged by a broad spectrum of investors, traders, and analysts for its ability to interpret behavioral financial trends. A set of specialized tools enables an in-depth analysis of how variations in supply and demand for specific securities might affect price, volume, and potential volatility.
Globally, technical analysis has established its importance in understanding market patterns and has been recognized by academic and regulatory institutions.
In this guide, we aim to elucidate the nuances of technical analysis, detailing its indicators, foundational principles, and more.

A Closer Look at Technical Analysis
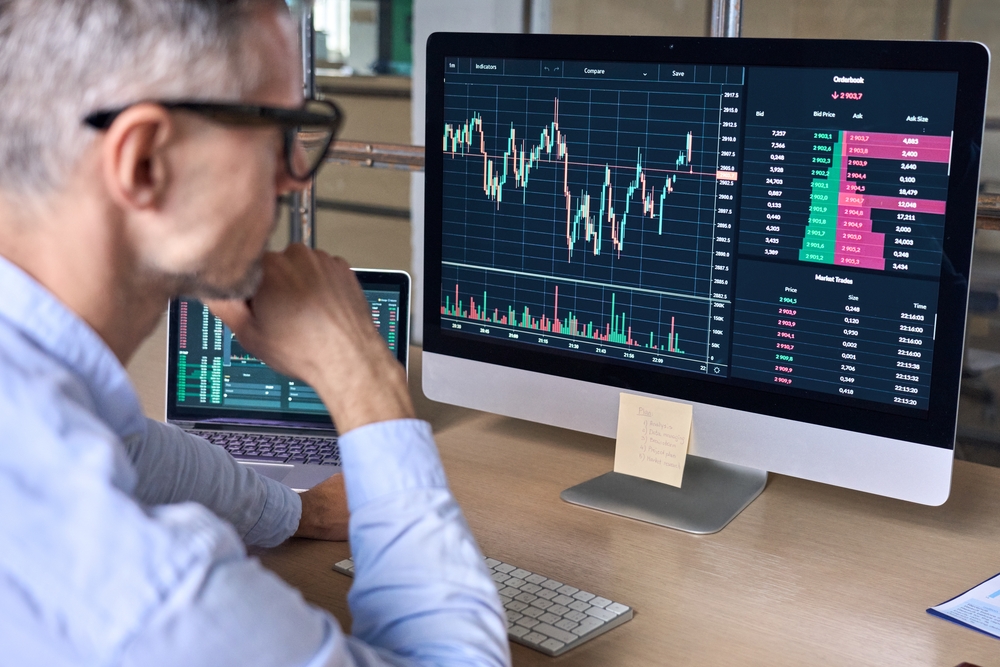
Technical analysis is a methodology employed to identify investment opportunities, relying on past price and volume data. This approach involves examining historical market charts to predict potential price movements. Through these charts, trends, support and resistance levels, and possible turning points can be identified.
Contrasting fundamental analysis, which concentrates on a company’s financial health and performance, technical analysis focuses solely on market data. Its techniques evaluate how security supply and demand dynamics influence price changes and trading volumes.
Insights from technical analysis further refine an analyst’s valuation predictions. This field has broadened over time and through rigorous research to include an extensive range of patterns and signals.
Essential Principles of Technical Analysis
Technical analysis examines the price and volume of a wide range of securities. During this evaluation, some fundamental principles are evident:
- Price encapsulates information: All essential data is reflected in the price.
- Prices follow discernible trends: Ascending, descending, or remaining constant.
- Historical patterns: Charts and trends often exhibit a cyclical nature.
- Support and resistance levels: Certain price points are influential barriers in determining price movement.
- Volume significance: Trading volume can corroborate or challenge the current trend’s strength.
Technical Analysis Indicators
Indicators result from mathematical computations using price and volume data as trading signals. Common indicators in technical analysis include price trajectories, chart patterns, volume metrics, oscillators, and moving averages.
Some indicators primarily identify the current market trends, while others assess the strength and potential longevity of these trends. Together, these indicators assist traders in understanding market conditions and trend dynamics.
Visual Representations in Technical Analysis
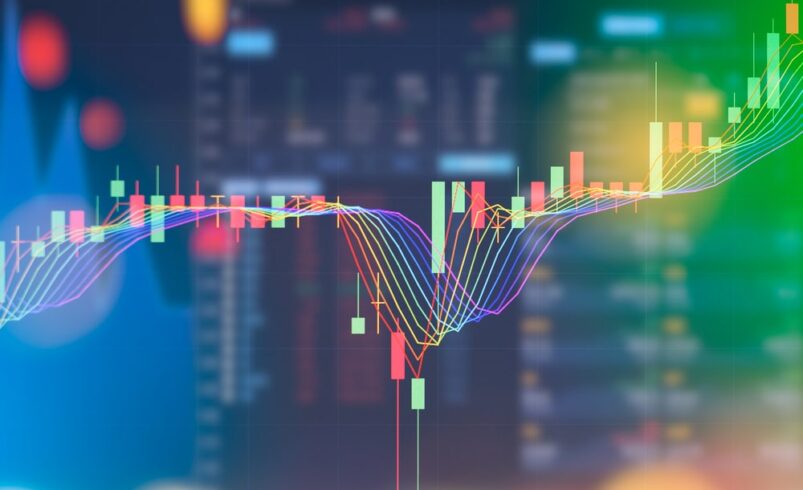
Technical analysis is presented through several chart types:
- Line Charts: These basic charts represent closing prices over specified durations, allowing for a sequential data comparison.
- Bar Charts: Offering a more comprehensive view, bar charts display open, high, low, and close prices for specific periods, providing a deeper understanding of price shifts.
- Candlestick Charts: These charts offer insights into price movement and investor sentiment by depicting price relations and investor sentiment through their unique design.

Comparing Technical and Fundamental Analysis
While technical and fundamental analyses are pivotal in predicting future stock price trends, each follows its distinctive approach, drawing its supporters and critics.
Fundamental analysis dives deep into the evaluation of securities by aiming to pinpoint the intrinsic value of a stock. This method requires a comprehensive study, ranging from macroeconomic factors and industry dynamics to the intricate details of a company’s financial health and governance. Key elements like earnings, expenditure, assets, and liabilities are the core of a fundamental analyst’s study.
On the other hand, technical analysis shifts its focus predominantly on the stock’s price and volume, sidelining detailed fundamental aspects. This approach is built on the belief that current stock prices reflect all known fundamentals. Rather than seeking a security’s intrinsic value, technical analysts employ stock charts to discern patterns and trends, forecasting future price directions.
The Significance of Technical Analysis
Emphasizing the undeniable importance of technical analysis in the financial realm is crucial. For decades, this approach has served traders profoundly by predicting potential price trajectories and suggesting strategic trading positions.
Moreover, technical analysis becomes especially relevant in scenarios where fundamental data, such as cryptocurrency, might be scant. A balanced investment strategy often emerges when technical analysis complements its fundamental counterpart. Key utilities of technical analysis include:
- Trade Timing: It aids traders in determining the most favorable moments to enter or exit trades.
- Risk Strategy: By pinpointing support and resistance thresholds, traders can employ stop-loss mechanisms to control risks effectively.
- Market Mood Analysis: One can glean insights into the prevailing market sentiment through chart patterns and specific indicators.
- Short-Term Trade Benefits: Those eyeing short-term gains from price volatility find technical analysis invaluable.
Conclusion
Technical analysis is an influential instrument for traders and investors seeking data-driven insights drawn from past price and volume trends. While skeptics may voice reservations, countless market enthusiasts leverage chart analyses and patterns for future price movement predictions.
Investing doesn’t mandate a finance degree, but a solid grasp of financial trends is imperative for informed investment choices. In this context, technical analysis emerges as a potent educational tool, empowering investors to fathom market dynamics and anticipate upcoming trends.
DISCLAIMER: It's essential to understand that the content on this page is not meant to serve as, nor should it be construed as, advice in legal, tax, investment, financial, or any other professional context. You should only invest an amount that you are prepared to lose, and it's advisable to consult with an independent financial expert if you're uncertain. For additional details, please review the terms of service, as well as the help and support sections offered by the provider or promoter. While our website strives for precise and impartial journalism, please be aware that market conditions can shift unexpectedly and some (not all) of the posts on this website are paid or sponsored posts.